Gain a complete understanding of your money habits with a mix of free core visual analytics and deep Pro-tier pattern intelligence:
Core Analytics (Free for Everyone)
The dedicated Analytics tab in Kuber provides instant, interactive insights without requiring a paid subscription:
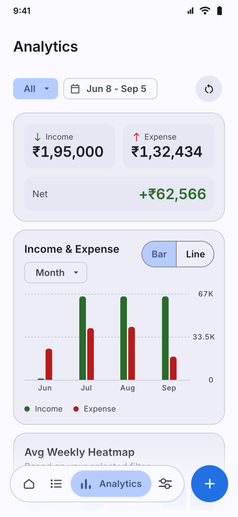
- Income and Expense Comparisons: Toggle between Day, Week, or Month scales, and switch between Bar or Line charts to track net cash flow across any date range.
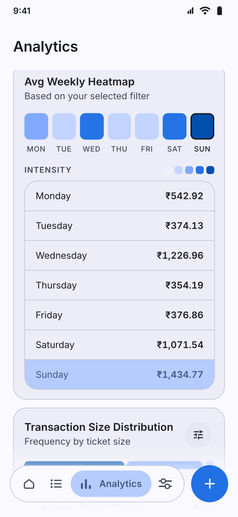
- Average Weekly Heatmap: See which days of the week you spend the most, complete with intensity blocks and precise daily average figures.
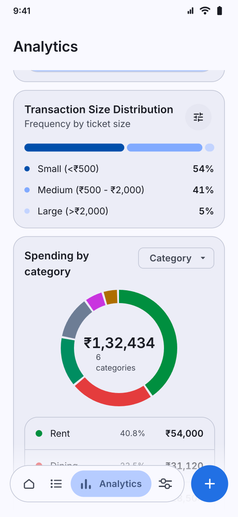
- Transaction Size Distribution: Understand your spending profile across ticket sizes: Small (<₹500), Medium (₹500 - ₹2,000), and Large (>₹2,000).
- Spending by Category and Group: Interactive donut charts highlighting category share percentages, totals, and group-level rollups.
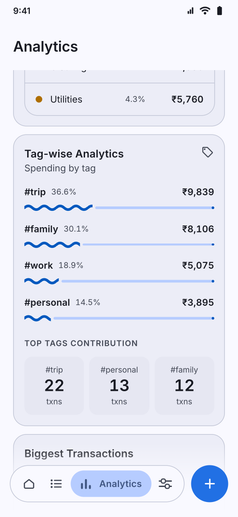
- Tag-wise Analytics and Top Spends: Track project or event costs using tags like
#trip,#family, or#work, and instantly view your biggest transactions.
Advanced Analytics (Kuber Pro Feature)
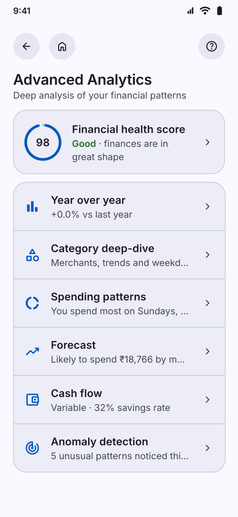
For users who want deeper financial diagnosis, Advanced Analytics adds algorithmic intelligence:
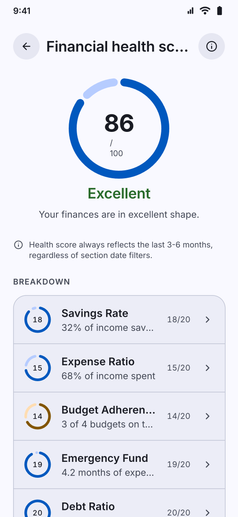
- Financial Health Score: Get an overarching score out of 100 with granular grading across your Savings Rate (out of 20), Expense Ratio (out of 20), Budget Adherence (out of 20), and Emergency Fund runway (out of 20).
- Behavioral Spending Patterns: Discover subtle habits automatically (such as peak spending days, time-of-day tendencies, and recurring spikes).
- Predictive Forecasting and Cash Flow: Intelligent month-end spending estimates, savings rate projections, and year-over-year growth comparisons.
- Anomaly Detection: Flags unusual transactions and sudden spending surges before they disrupt your monthly goals.
100% On-Device and Private
Every chart, ratio, and machine learning insight runs strictly on your smartphone. Your private transaction logs and net balances never leave your device.